In the stock market, lots of trader take trade just seeing any letter type Candlestick pattern made on chart. example like “W”,” M”,”V”, “U” . Today, this post about that pattern & solving answer of question “this type pattern really works? “.
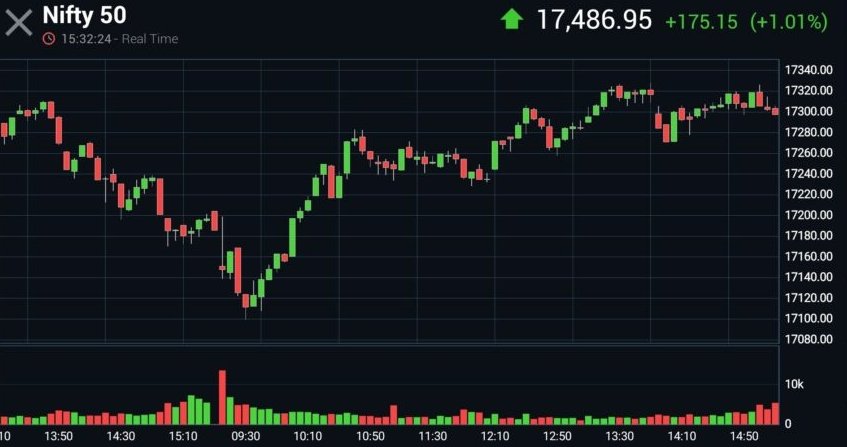
So, first question is why occure patterns in chart?
Pattern is basically demand & supply of the particular instrument. Also, it be occure because volatile volume of that instrument market value. There is buyer for every seller. This is reason for to become pattern in chart.
There is lot of types pattern in chart & it’s shows different trends of Market. Some of pattern is very popular in the traders.
Now, we are writing about that.
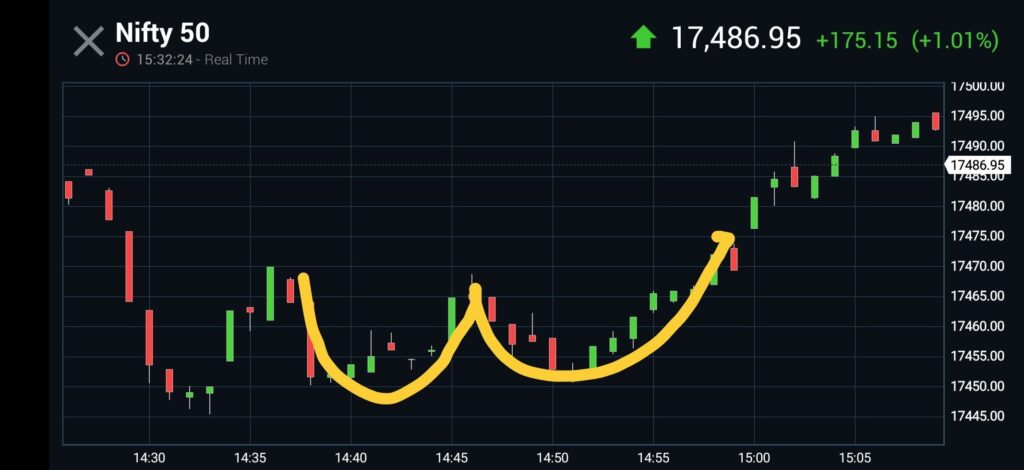
1) “W” Shape Pattern
“W” Pattern is chart playing a game between support & resistence. In any stock, option, commodity, currencies, shows price drop-down till last support or break-out & after that market take some positive trend & again hit that support. After some of period It take positive trend till on their previous resistance. Here became “W” Pattern on chart. It’s shows strong support side of the stock.
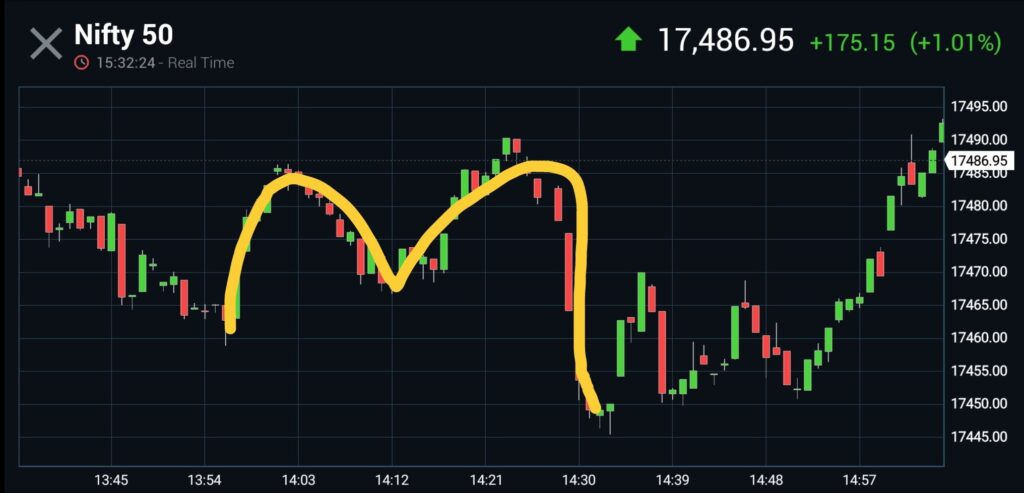
2) “M” Shape Pattern
The “M” pattern basically shows strong resistance on the chart. In the stock, option, commodity, or currency charts, price corrected after the particular bull rally & stock retested to break that resistance, but it failed & then it followed a bearish trend. That time made an “M” pattern on the chart.
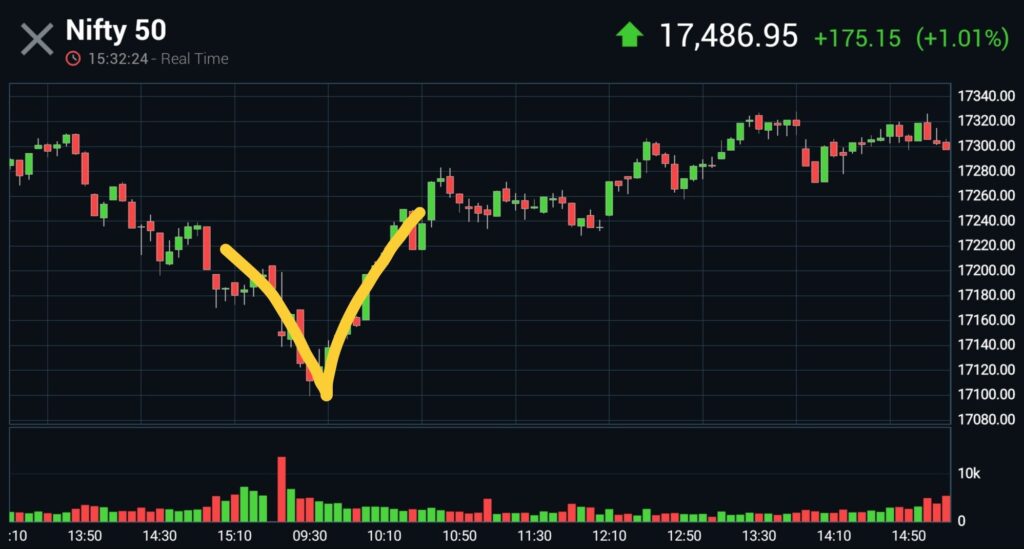
3) “V” Shape Pattern
“V” Pattern is basically drop & rise in the price of particular instrument. When price drop of any stock in the chart & it’s rises till previous resistance after testing support. Then became “V” Shape pattern on the chart.
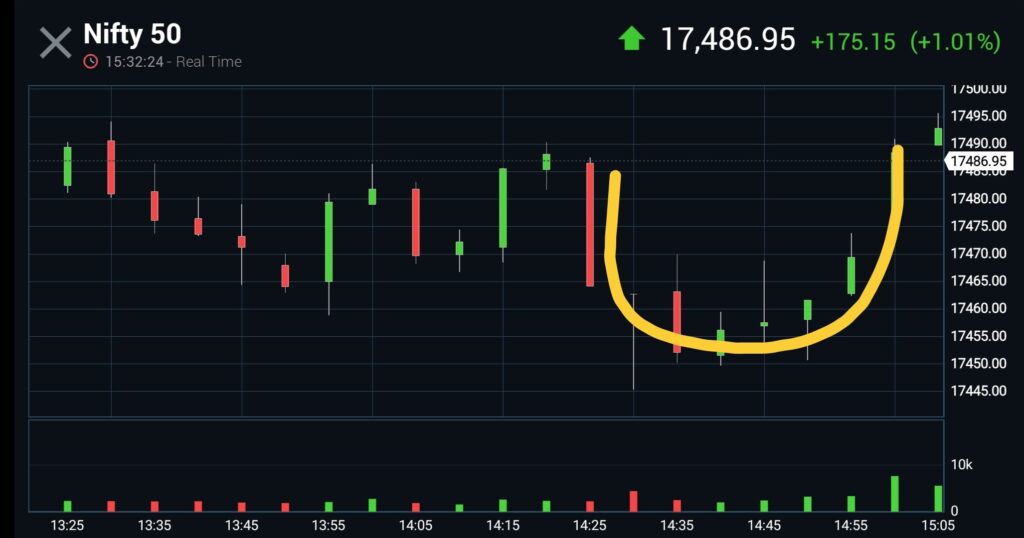
4) “U” Shape Pattern
In this pattern, stock drop & not take any movement for some of period. After that period stock take huge rally till break previous resistance. Then made “U” Shape pattern there.
All above charts are just showing of volatility between buyer & seller & it’s uncontrollable. Market is supreme & no one control that. So, there is no guarantee of stock made any pattern if they hit resistance or support.
Moral of the Article
All pattern are uncontrollable. It’s made because of price volatile gap in buyer & seller. Be careful when takes any tradeaccording to any pattern.
- Virat Kohli: A Businessman More Than a Cricketer विराट कोहली: एक क्रिकेटर से ज्यादा व्यापारी
- Personal Finance Apps : अच्छे या बुरे ?
- Best 5 Books on Finance वित्त पर शीर्ष ५ किताबें
- IPO of MamaEarth कया मामाअर्थ का आईपीओ डूबाएगा पैसा !!!
- Pan Card ऑनलाइन पैन कार्ड आवेदन कैसे करें: एक विस्तृत मार्गदर्शिका
We offer research reports on any kind of financial instrument. For those interested in using our service, click here.